In June of this year, I went to vote in the NYC Primary Election fully confident in my choice for mayor.
I consider myself politically engaged and well-informed. I had done my research, paid attention, and walked
into the voting booth without hesitation… until I looked at the ballot.
the problems
1. Most people don’t know who their local politicians are.
2. There’s a lack of accessible civic engagement tools.
3. The two-party system oversimplifies political identity.
4. Propaganda fills the information gap.
the solution
an ai-powered bipartisan civic engagement app designed to help voters make informed decisions. The app uses a three-axis political spectrum with 27 possible archetypes to map a user’s political identity. It then matches them with candidates and elections based on location. ai scores politicians.
scoring logic / the algorithm

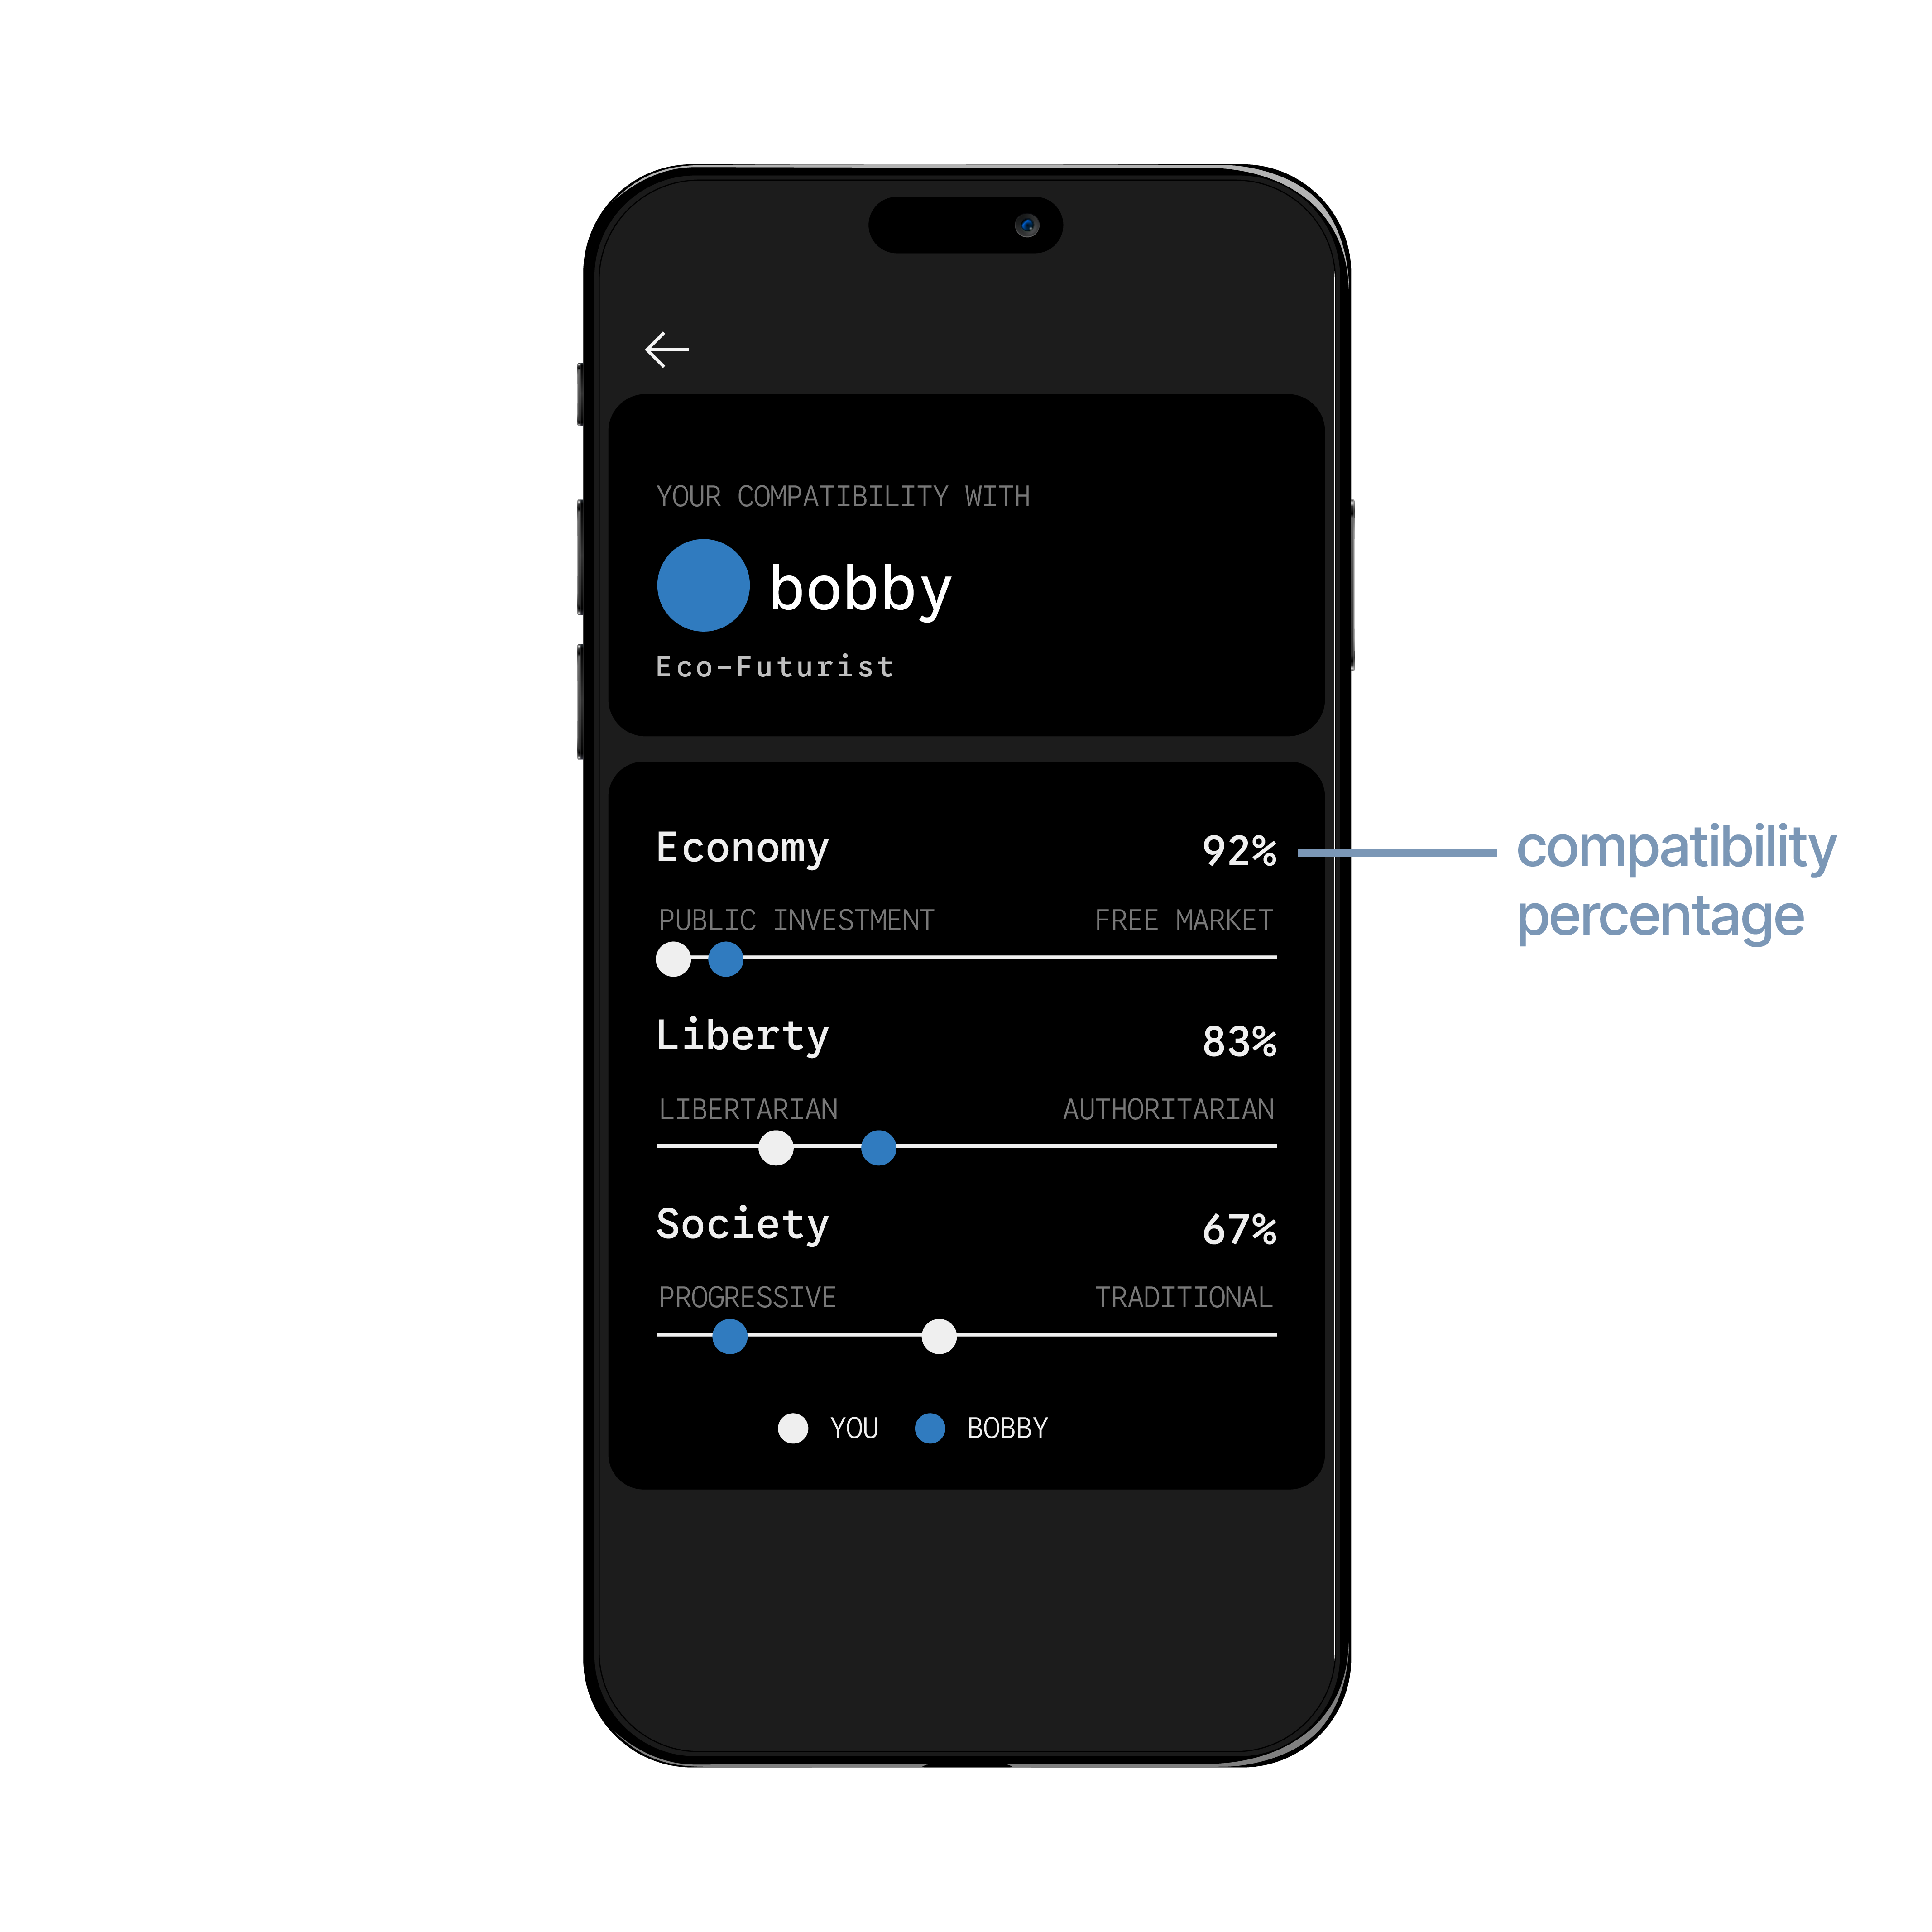
3 Axis: Economy (Public Investment vs Free Market), Liberty (Libertarian vs Authoritarian), Society (Progressive vs Traditional). Each axis goes from left to right (-2, -1, 0, 1, 2).
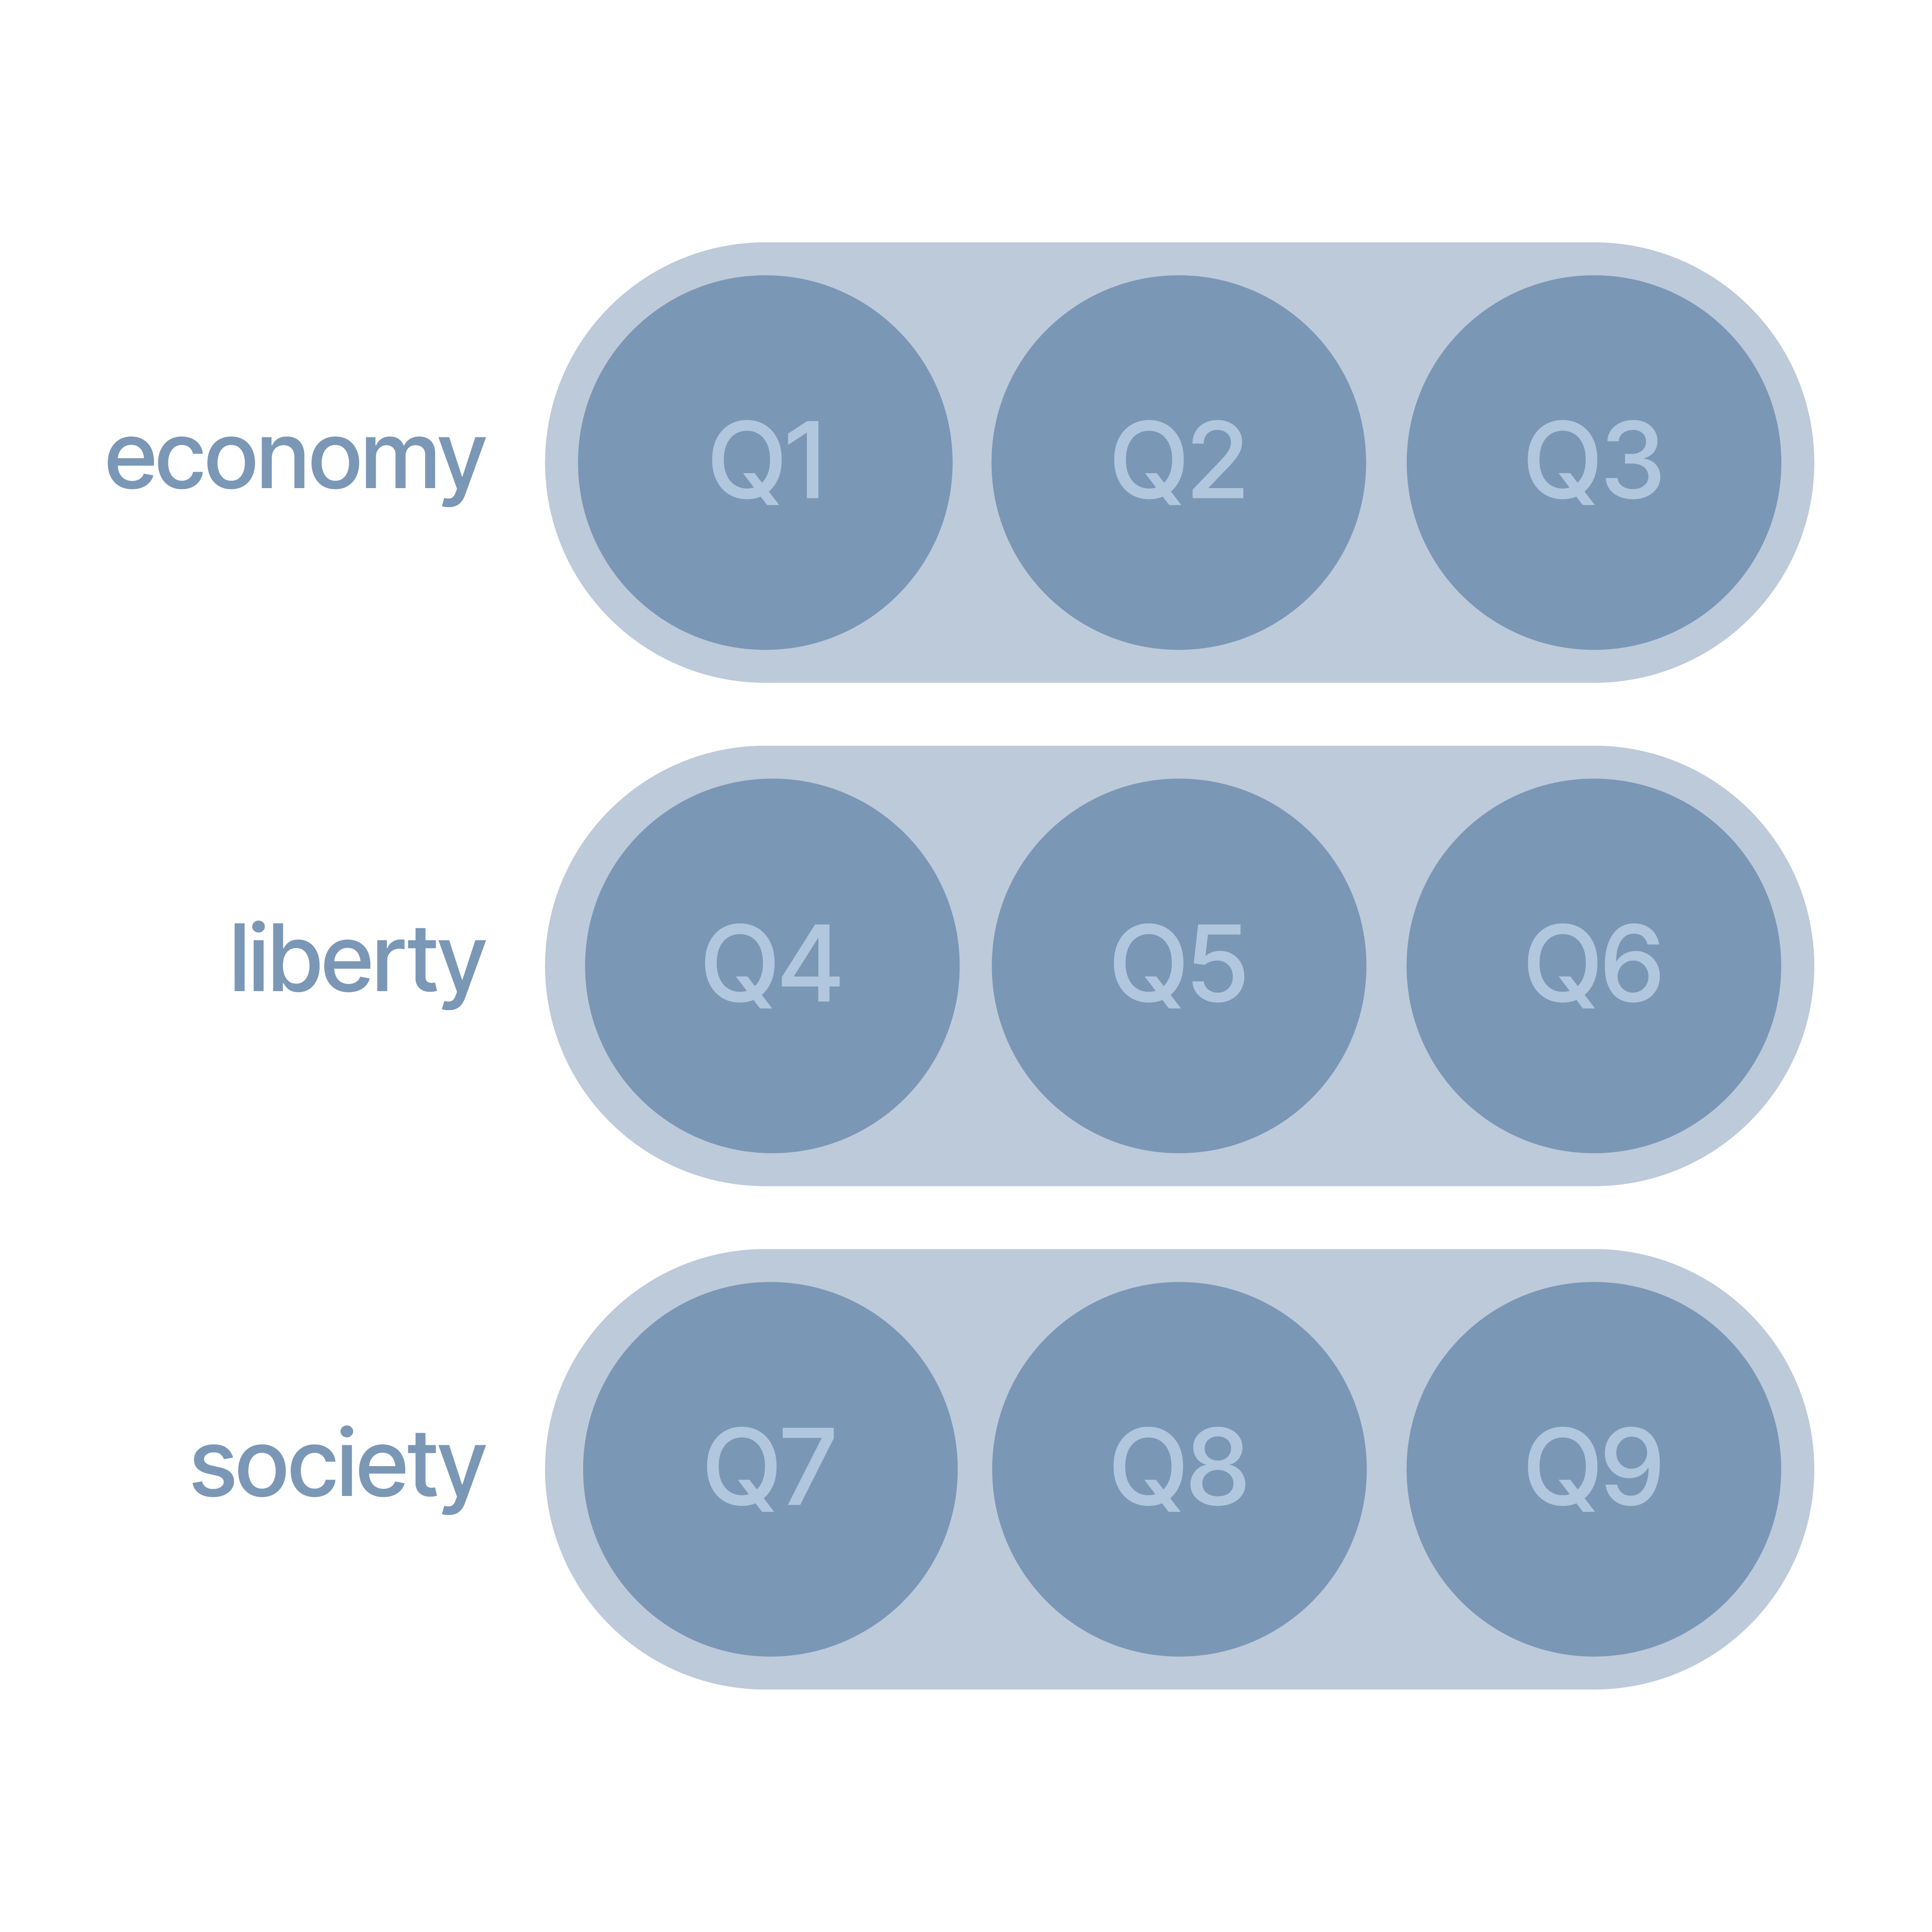
9 Initial Questions, Q1-Q3 = Economy, Q4-6 = Liberty, Q7-9 = Society.
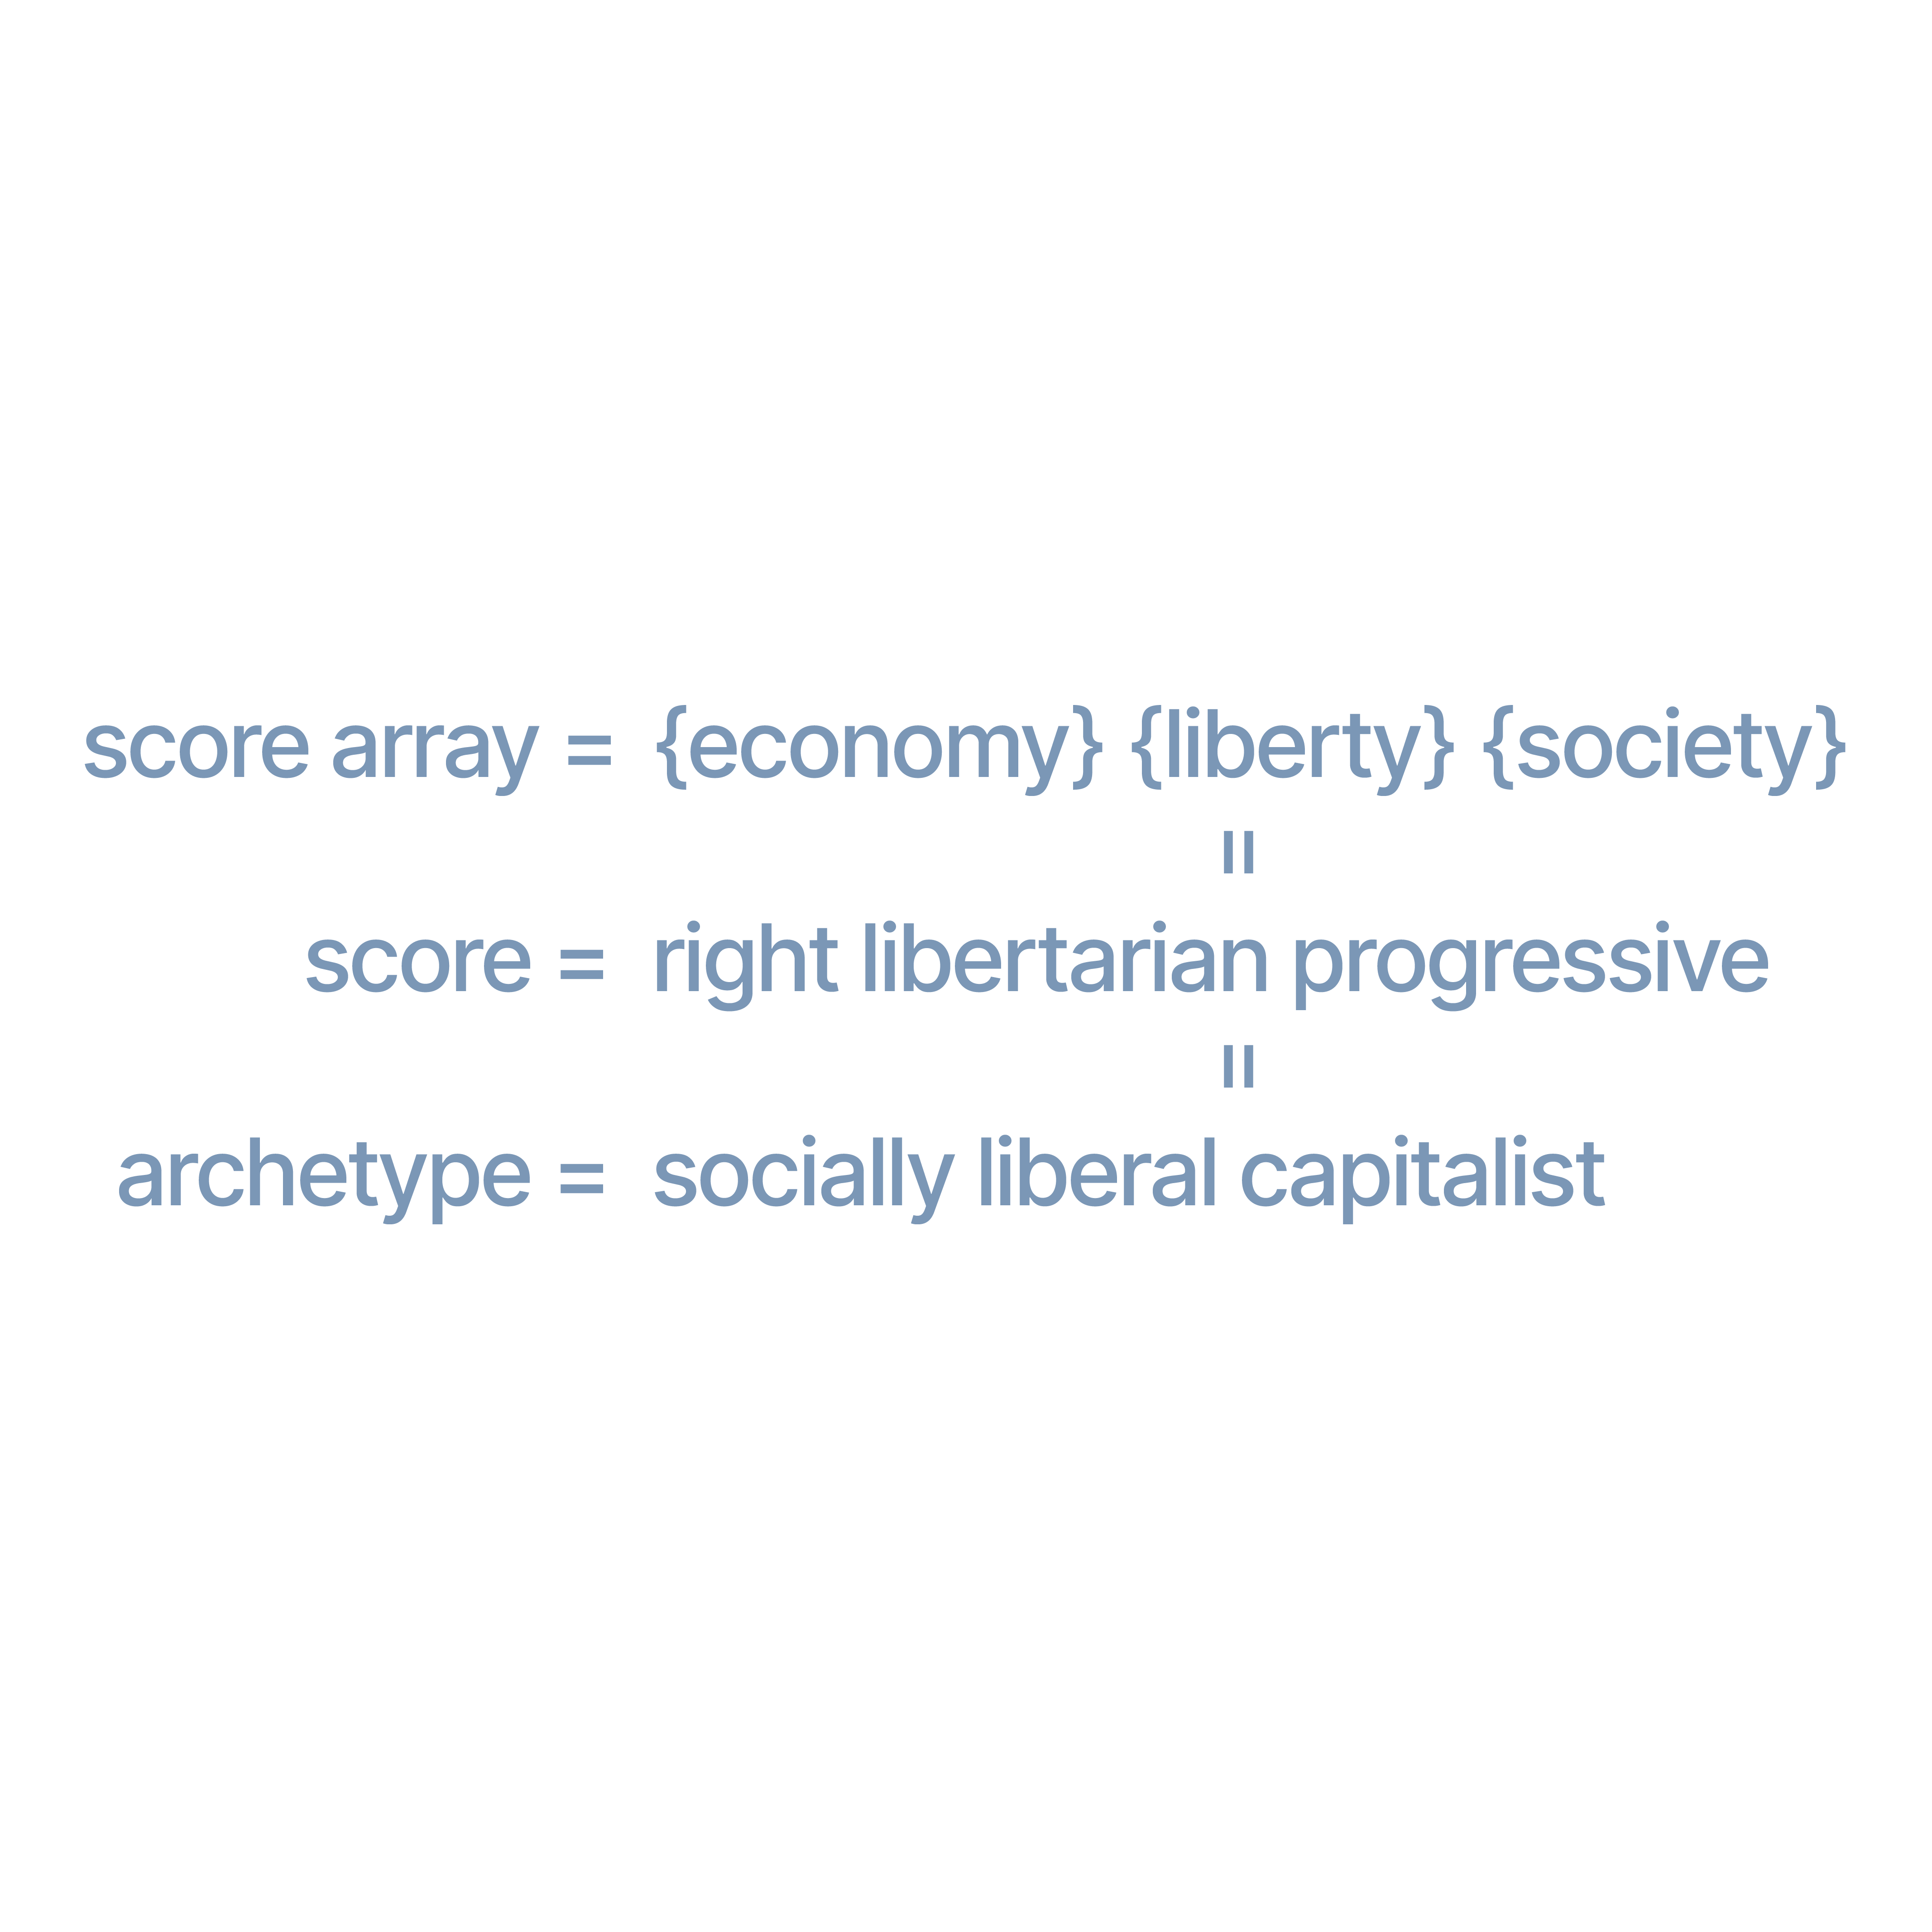
27 Archetypes ({economy score}, {liberty score}, {society score}).
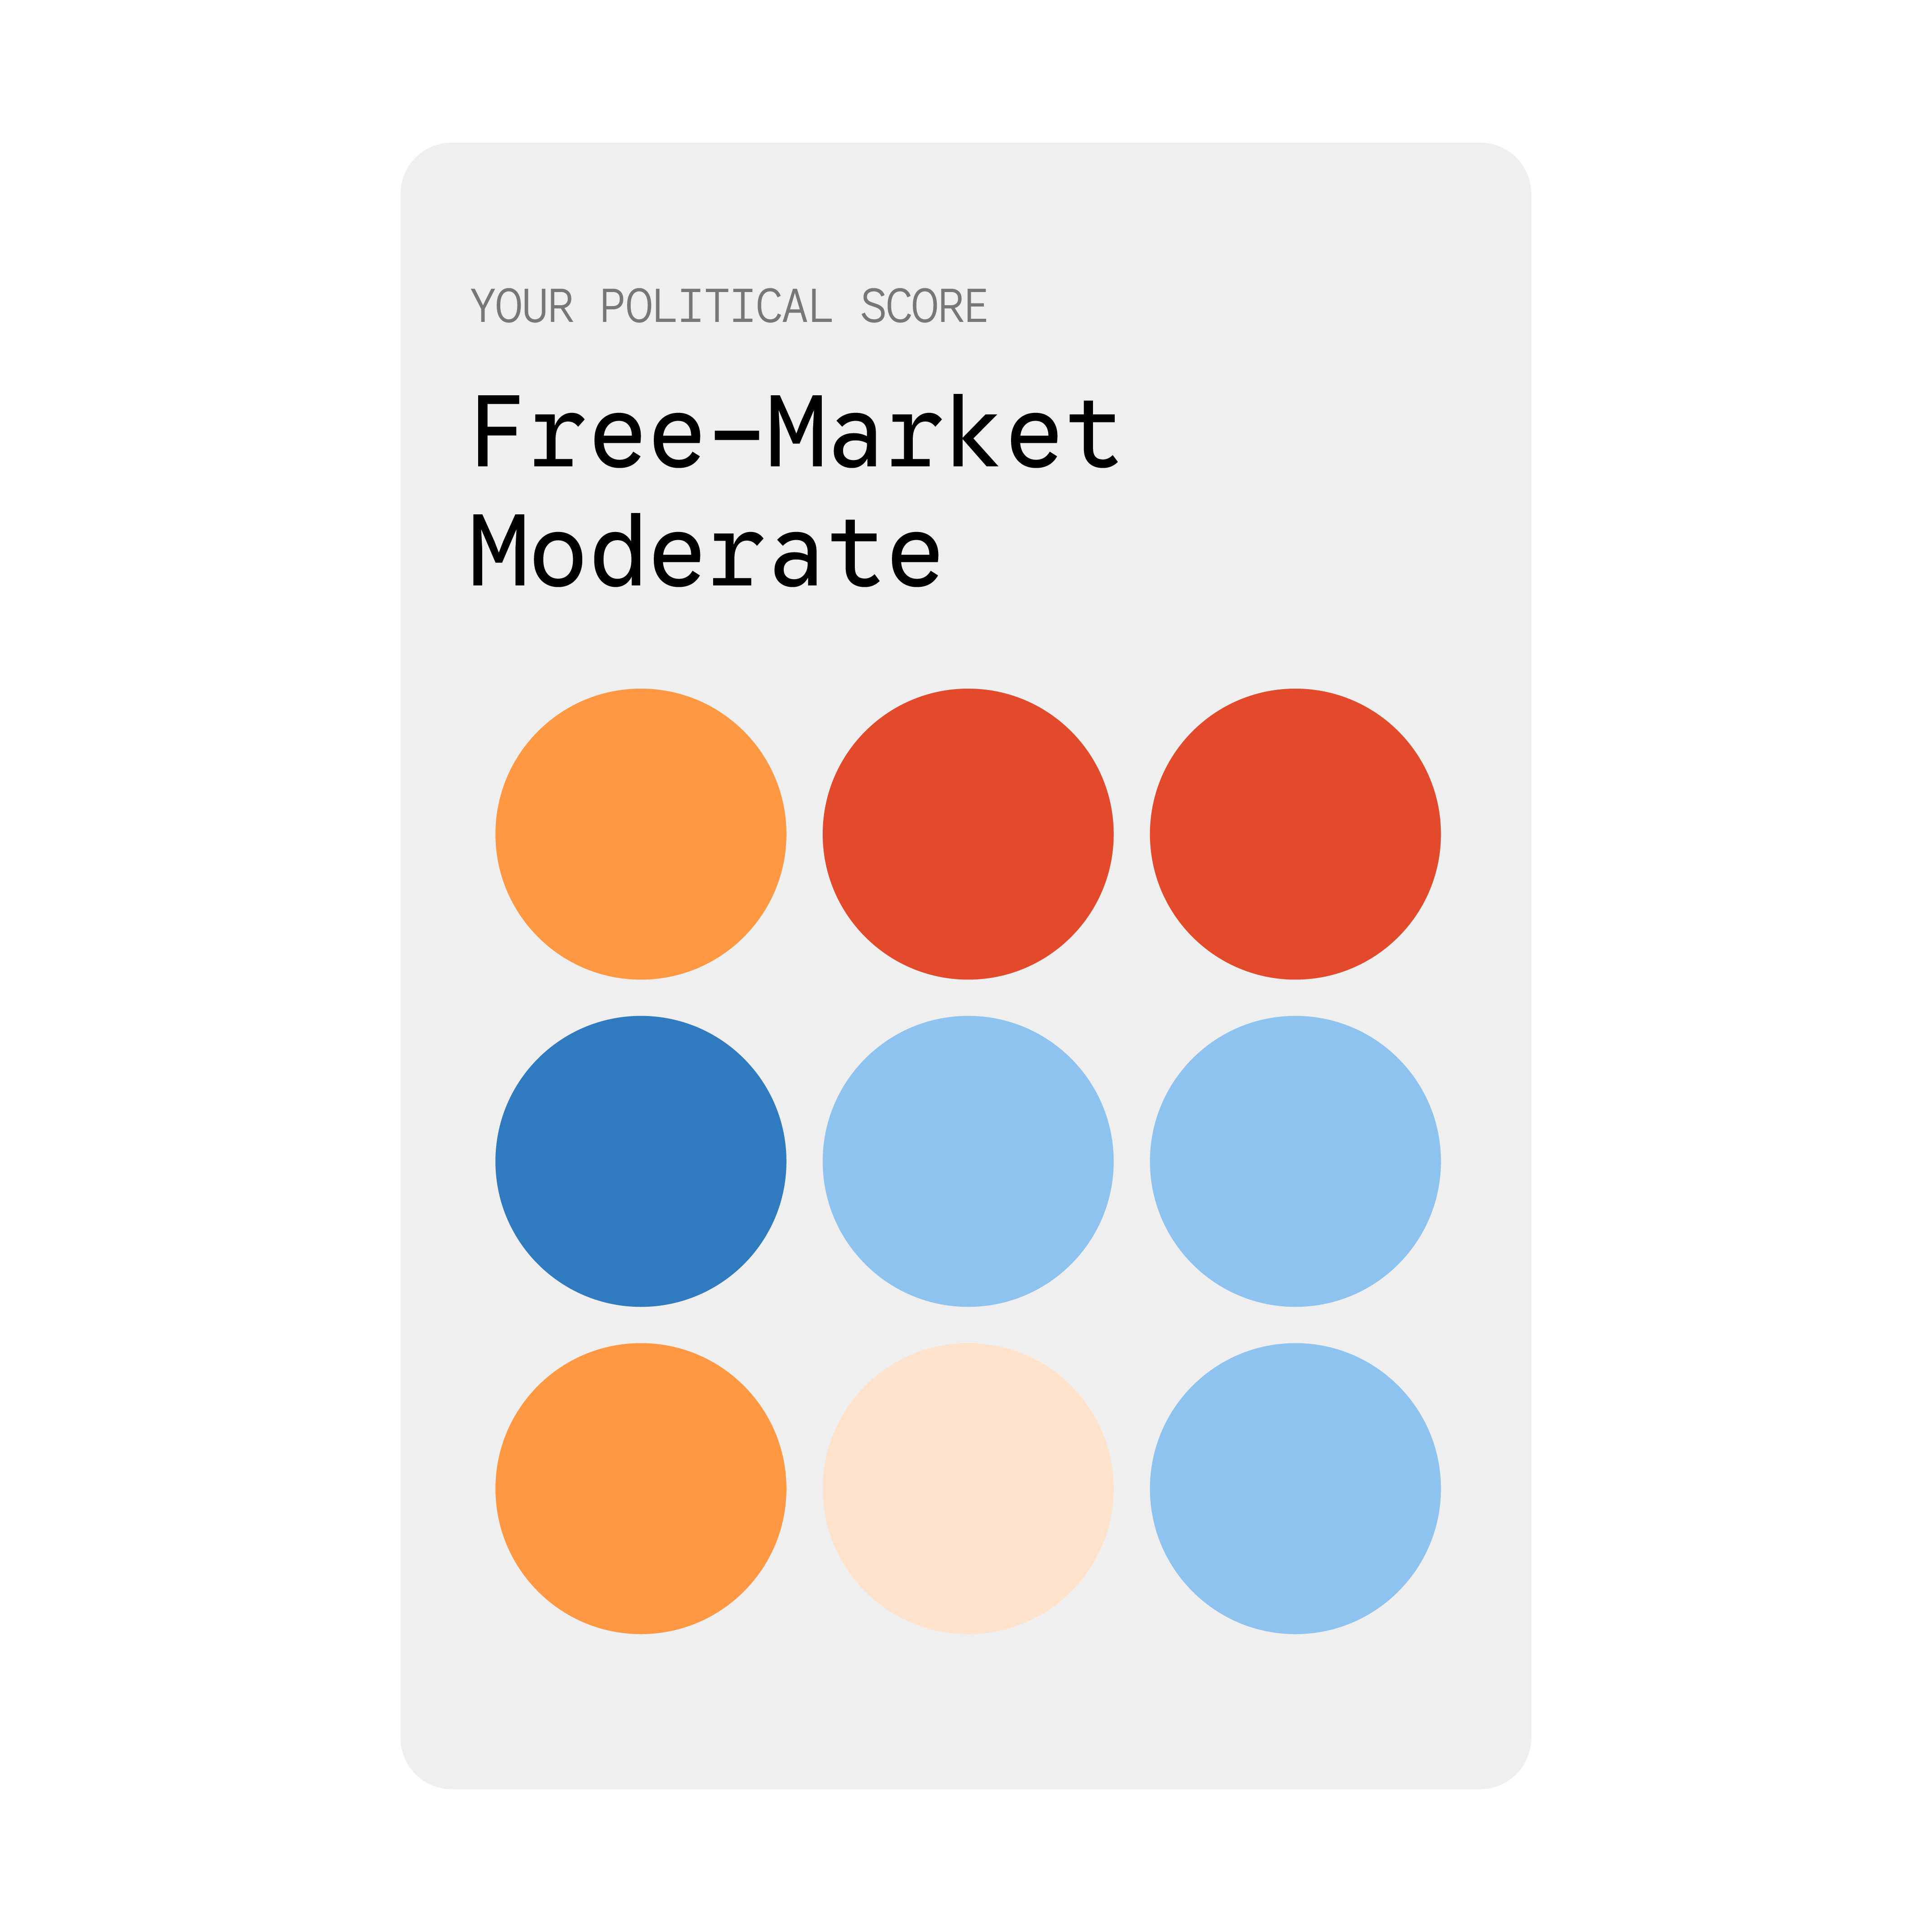
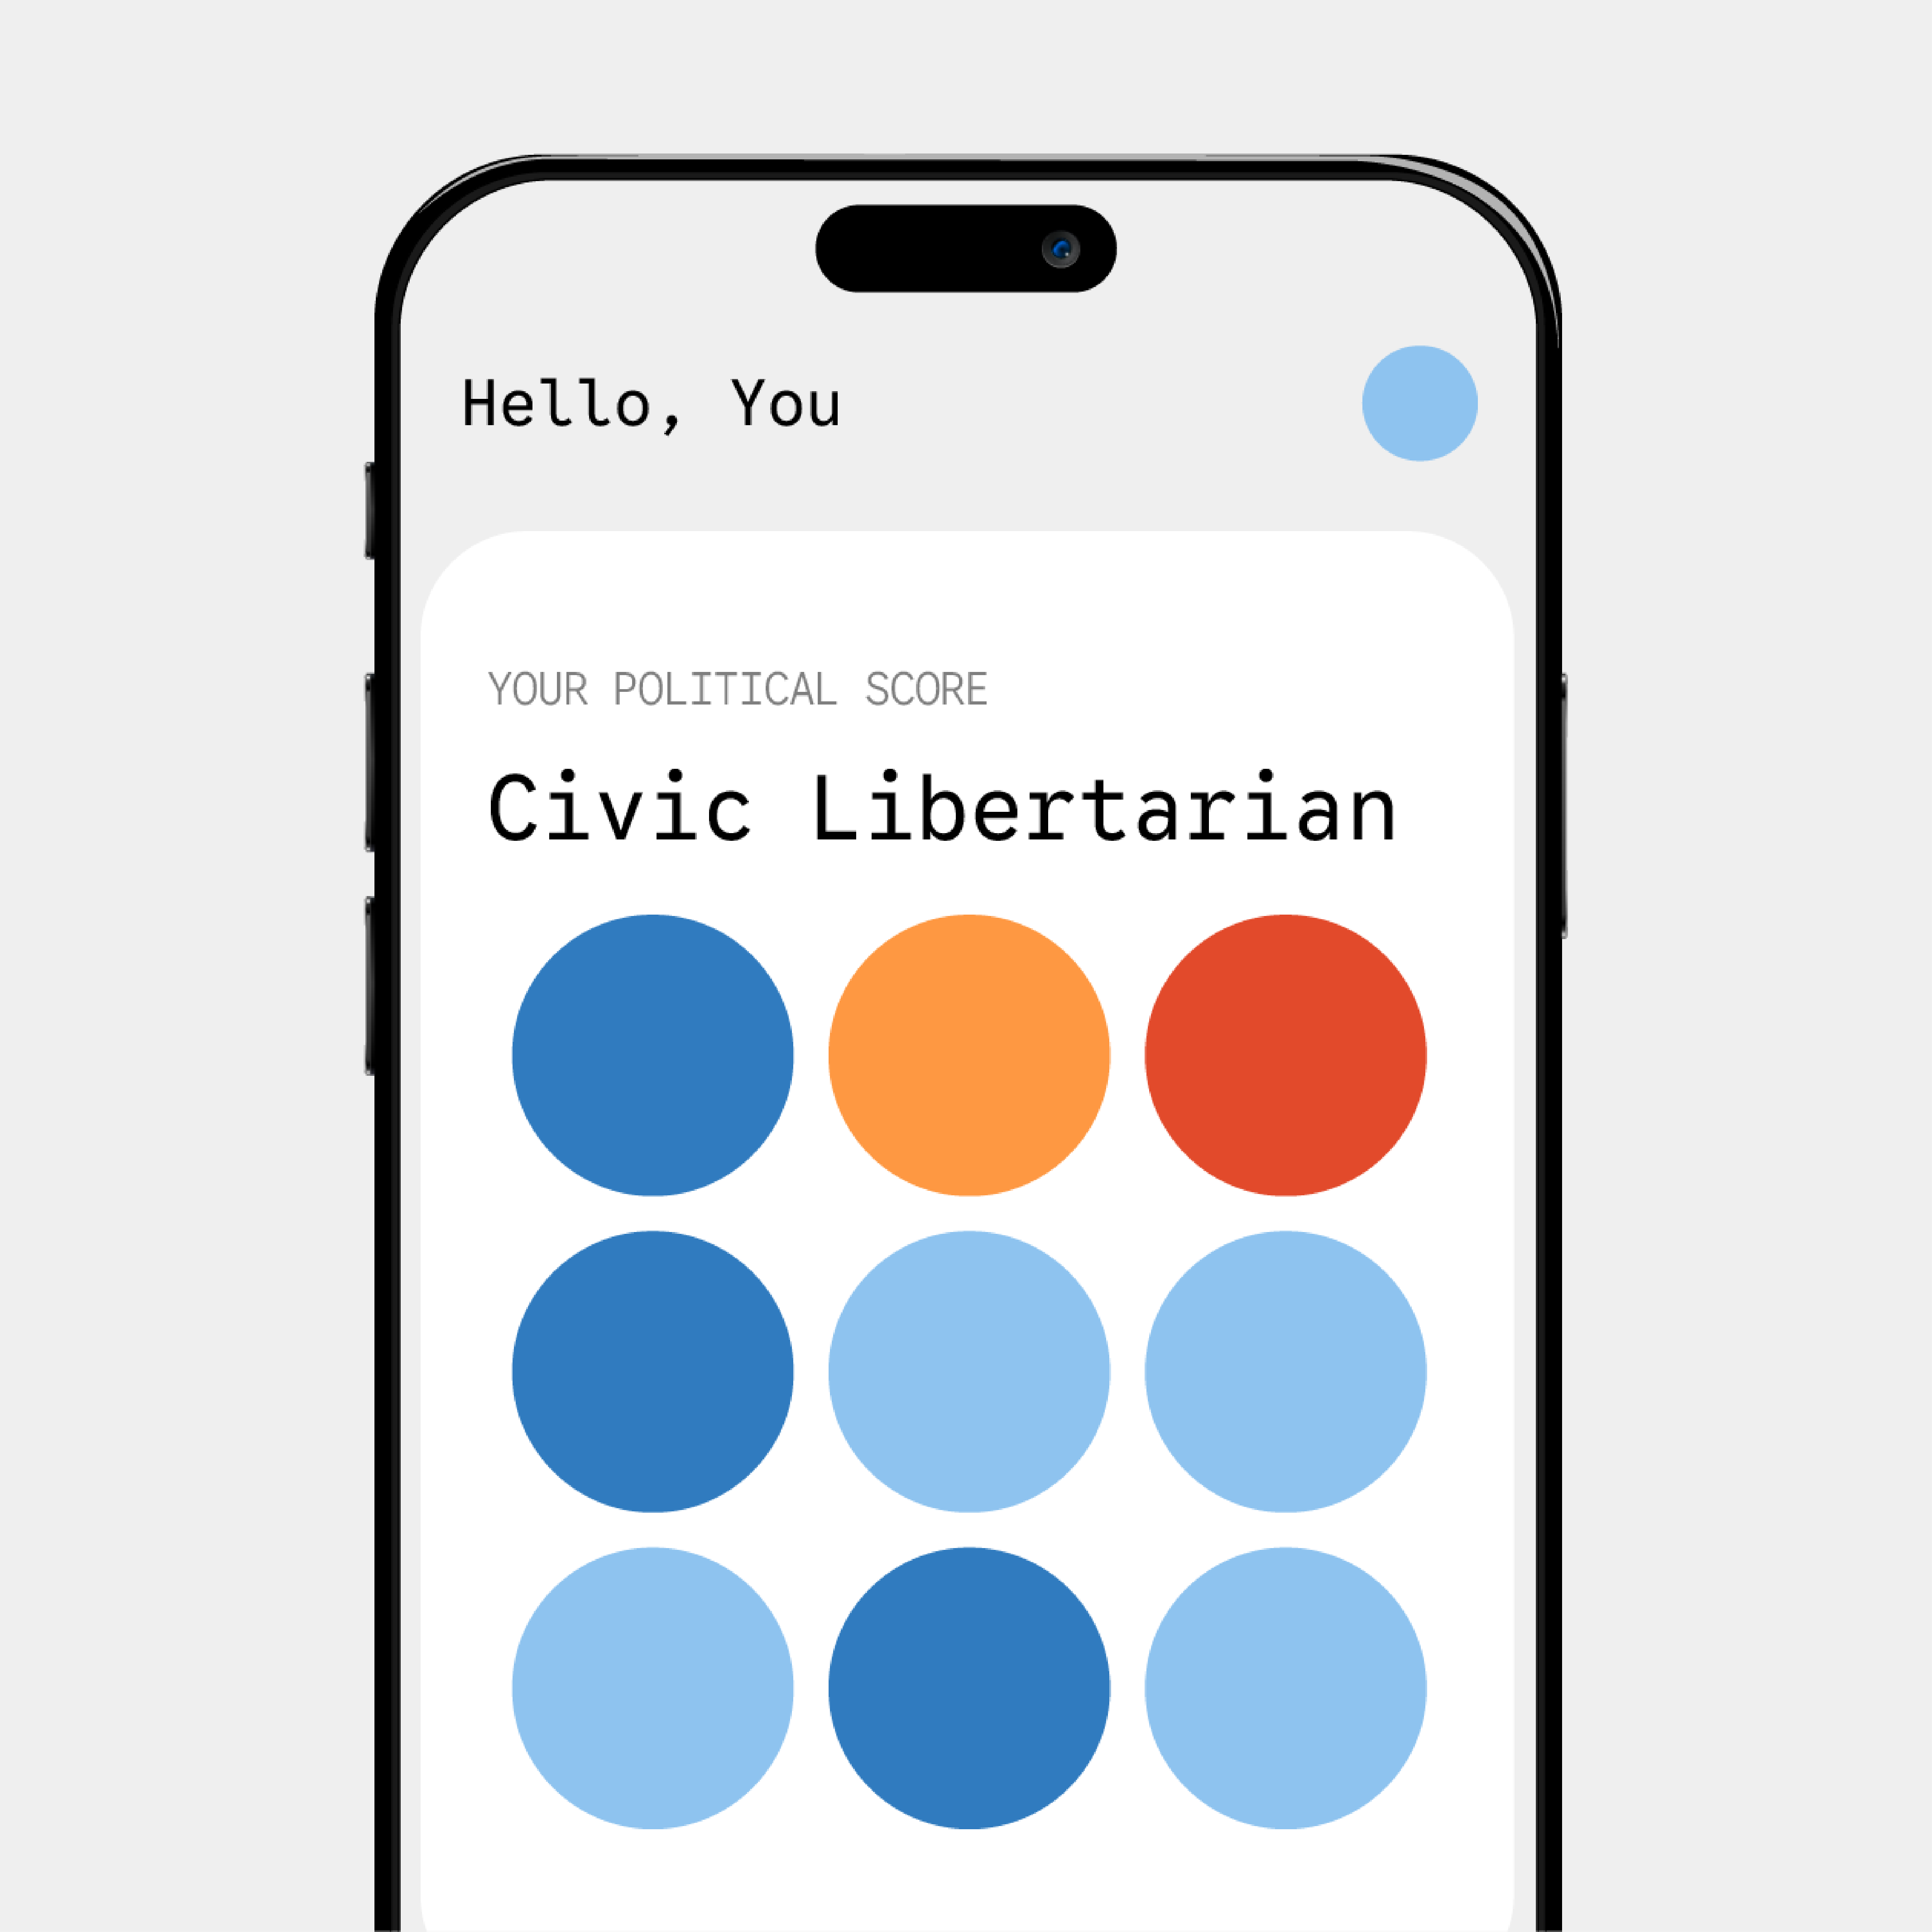
Answers from 9 questions create a color scoring grid (Dark Blue = -2, Light Blue = -1, Cream = 0, Orange = 1, Red = 2).
ai integration
candidate scoring: so i created a scoring system for users but how could I match users with political candidates without having the candidates themselves take the quiz? Well, I decided to use GPT-4 to act as each candidate when scoring them.
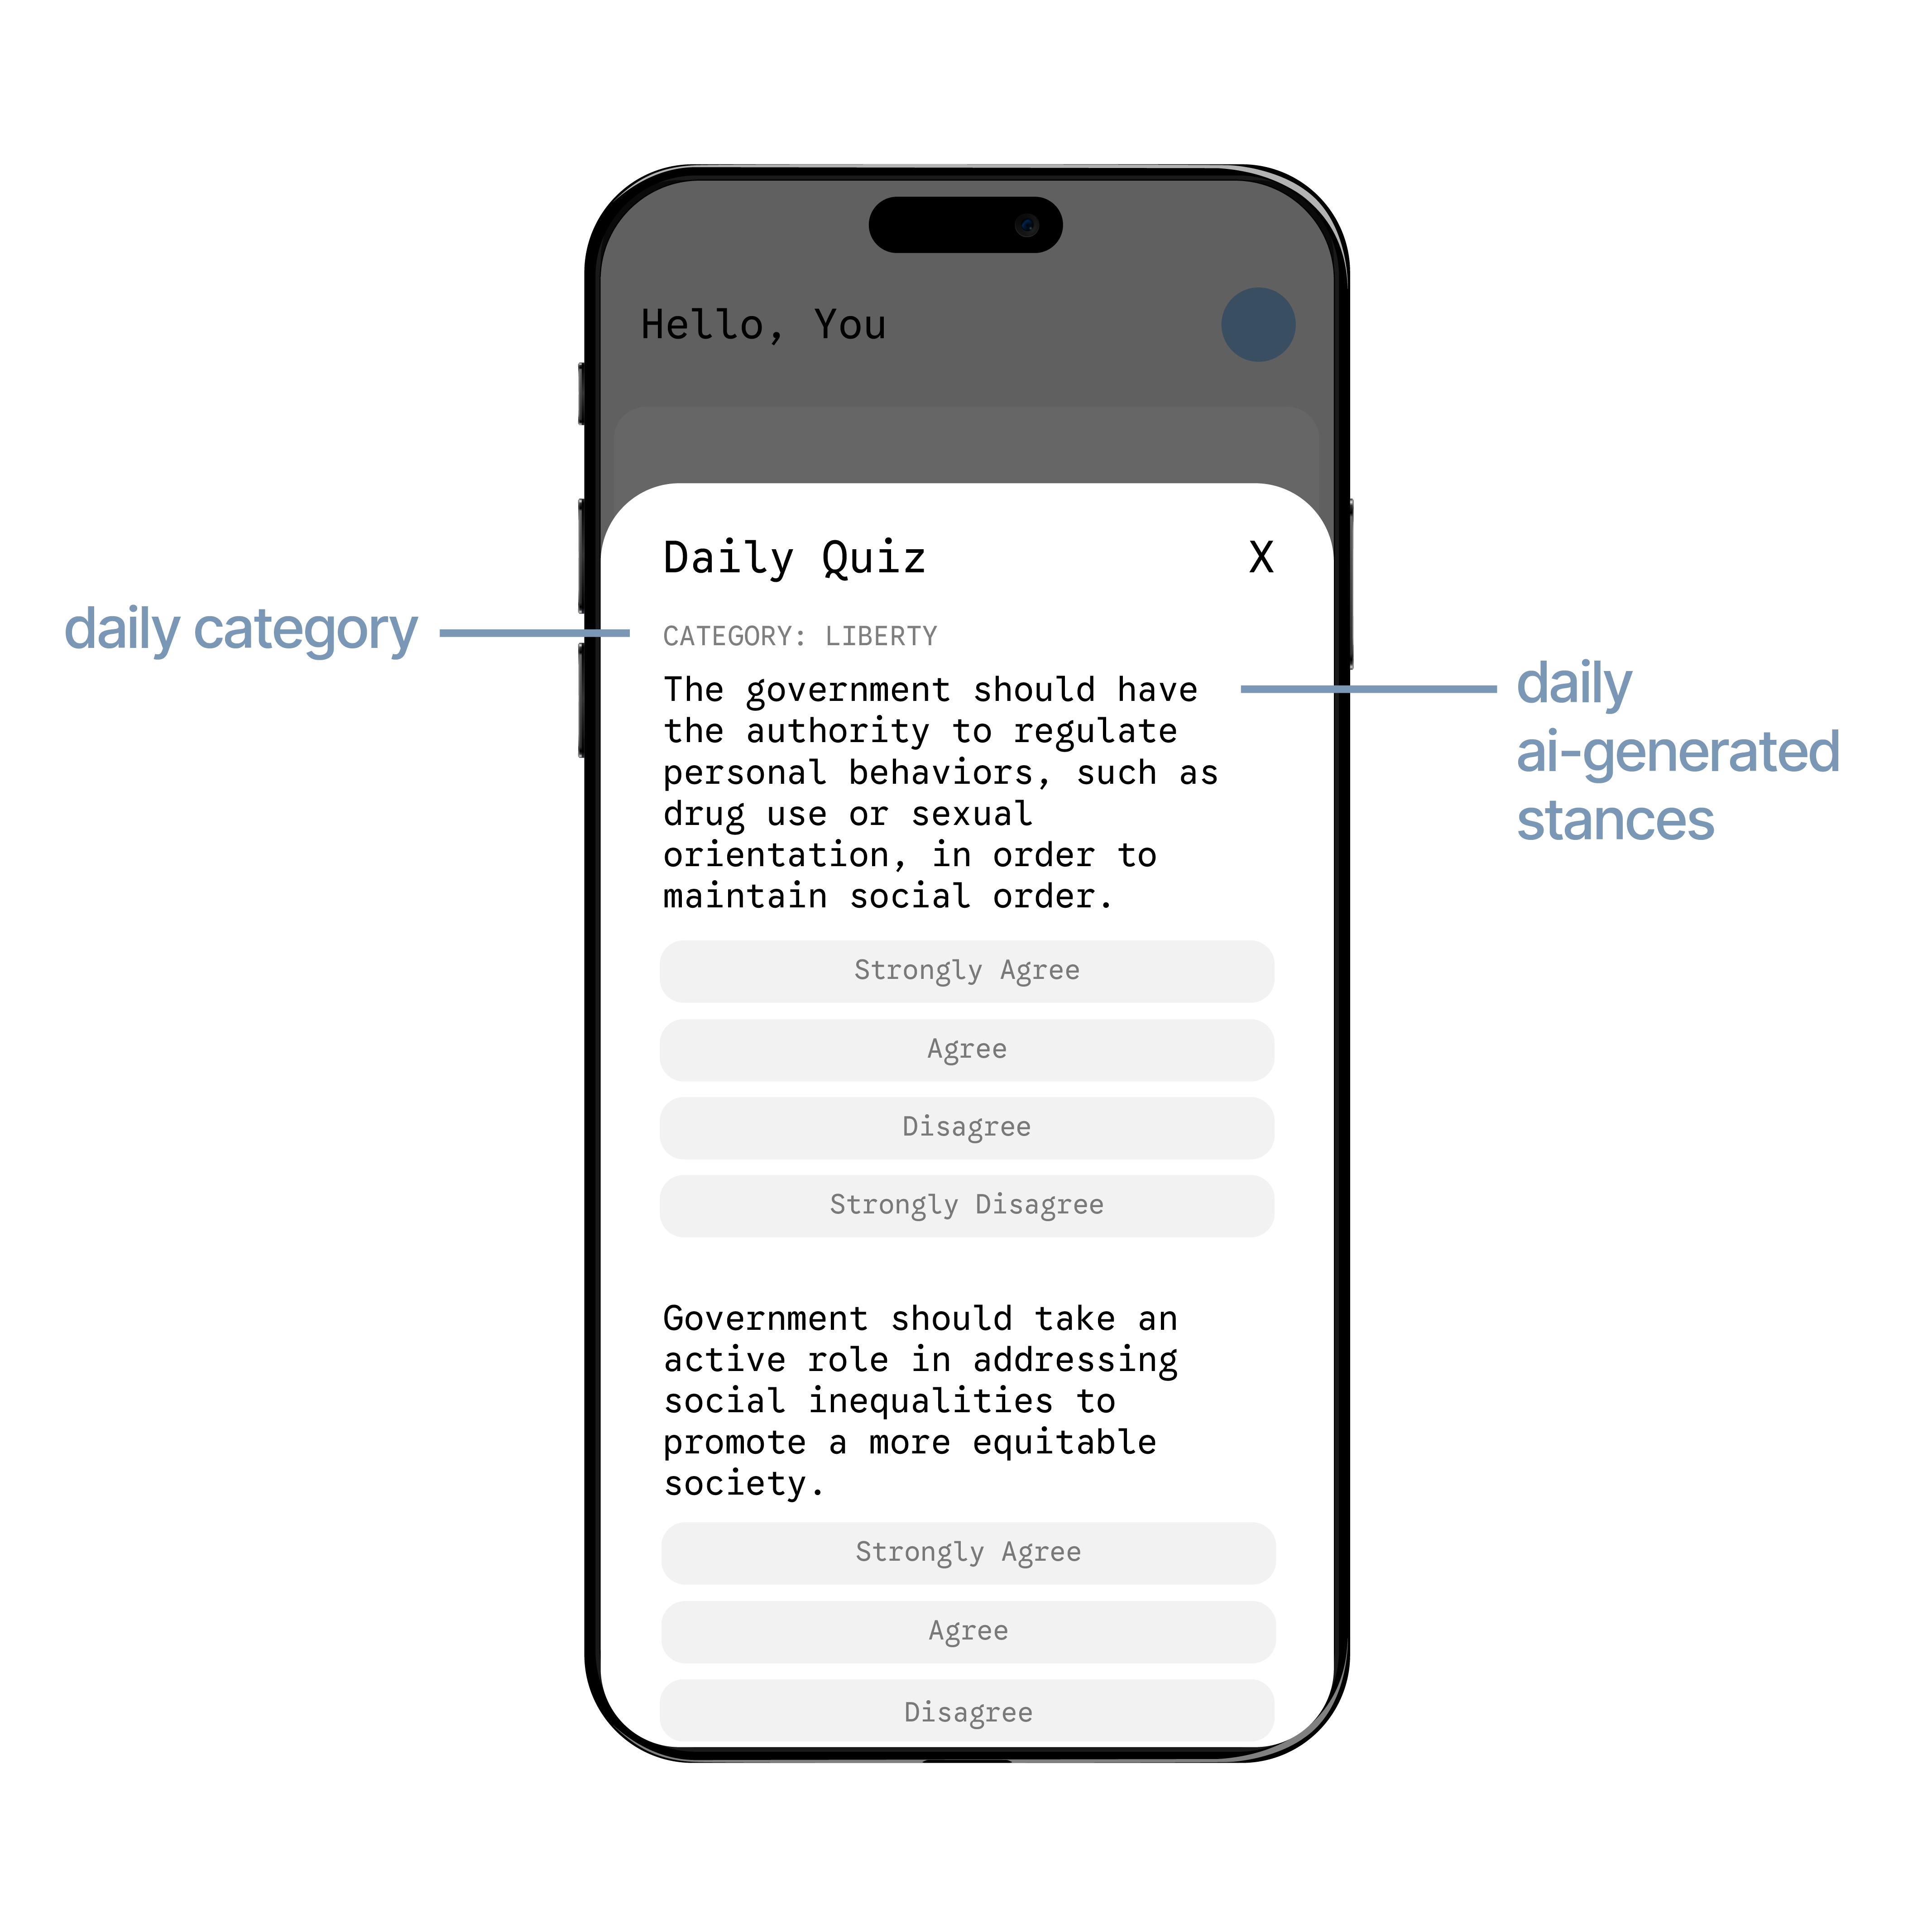
daily quiz generation: In order to stay up-to-date, a category is chosen by random every day (ex: Society) and then a quiz in that category is created using GPT-4 (3 questions). This is automated in Lambda. If it’s Society, the answers would affect Scores 6-8 in the user’ score array.
hot takes: every day, users recieve three ai-generated hot takes that align with their political score.
main features
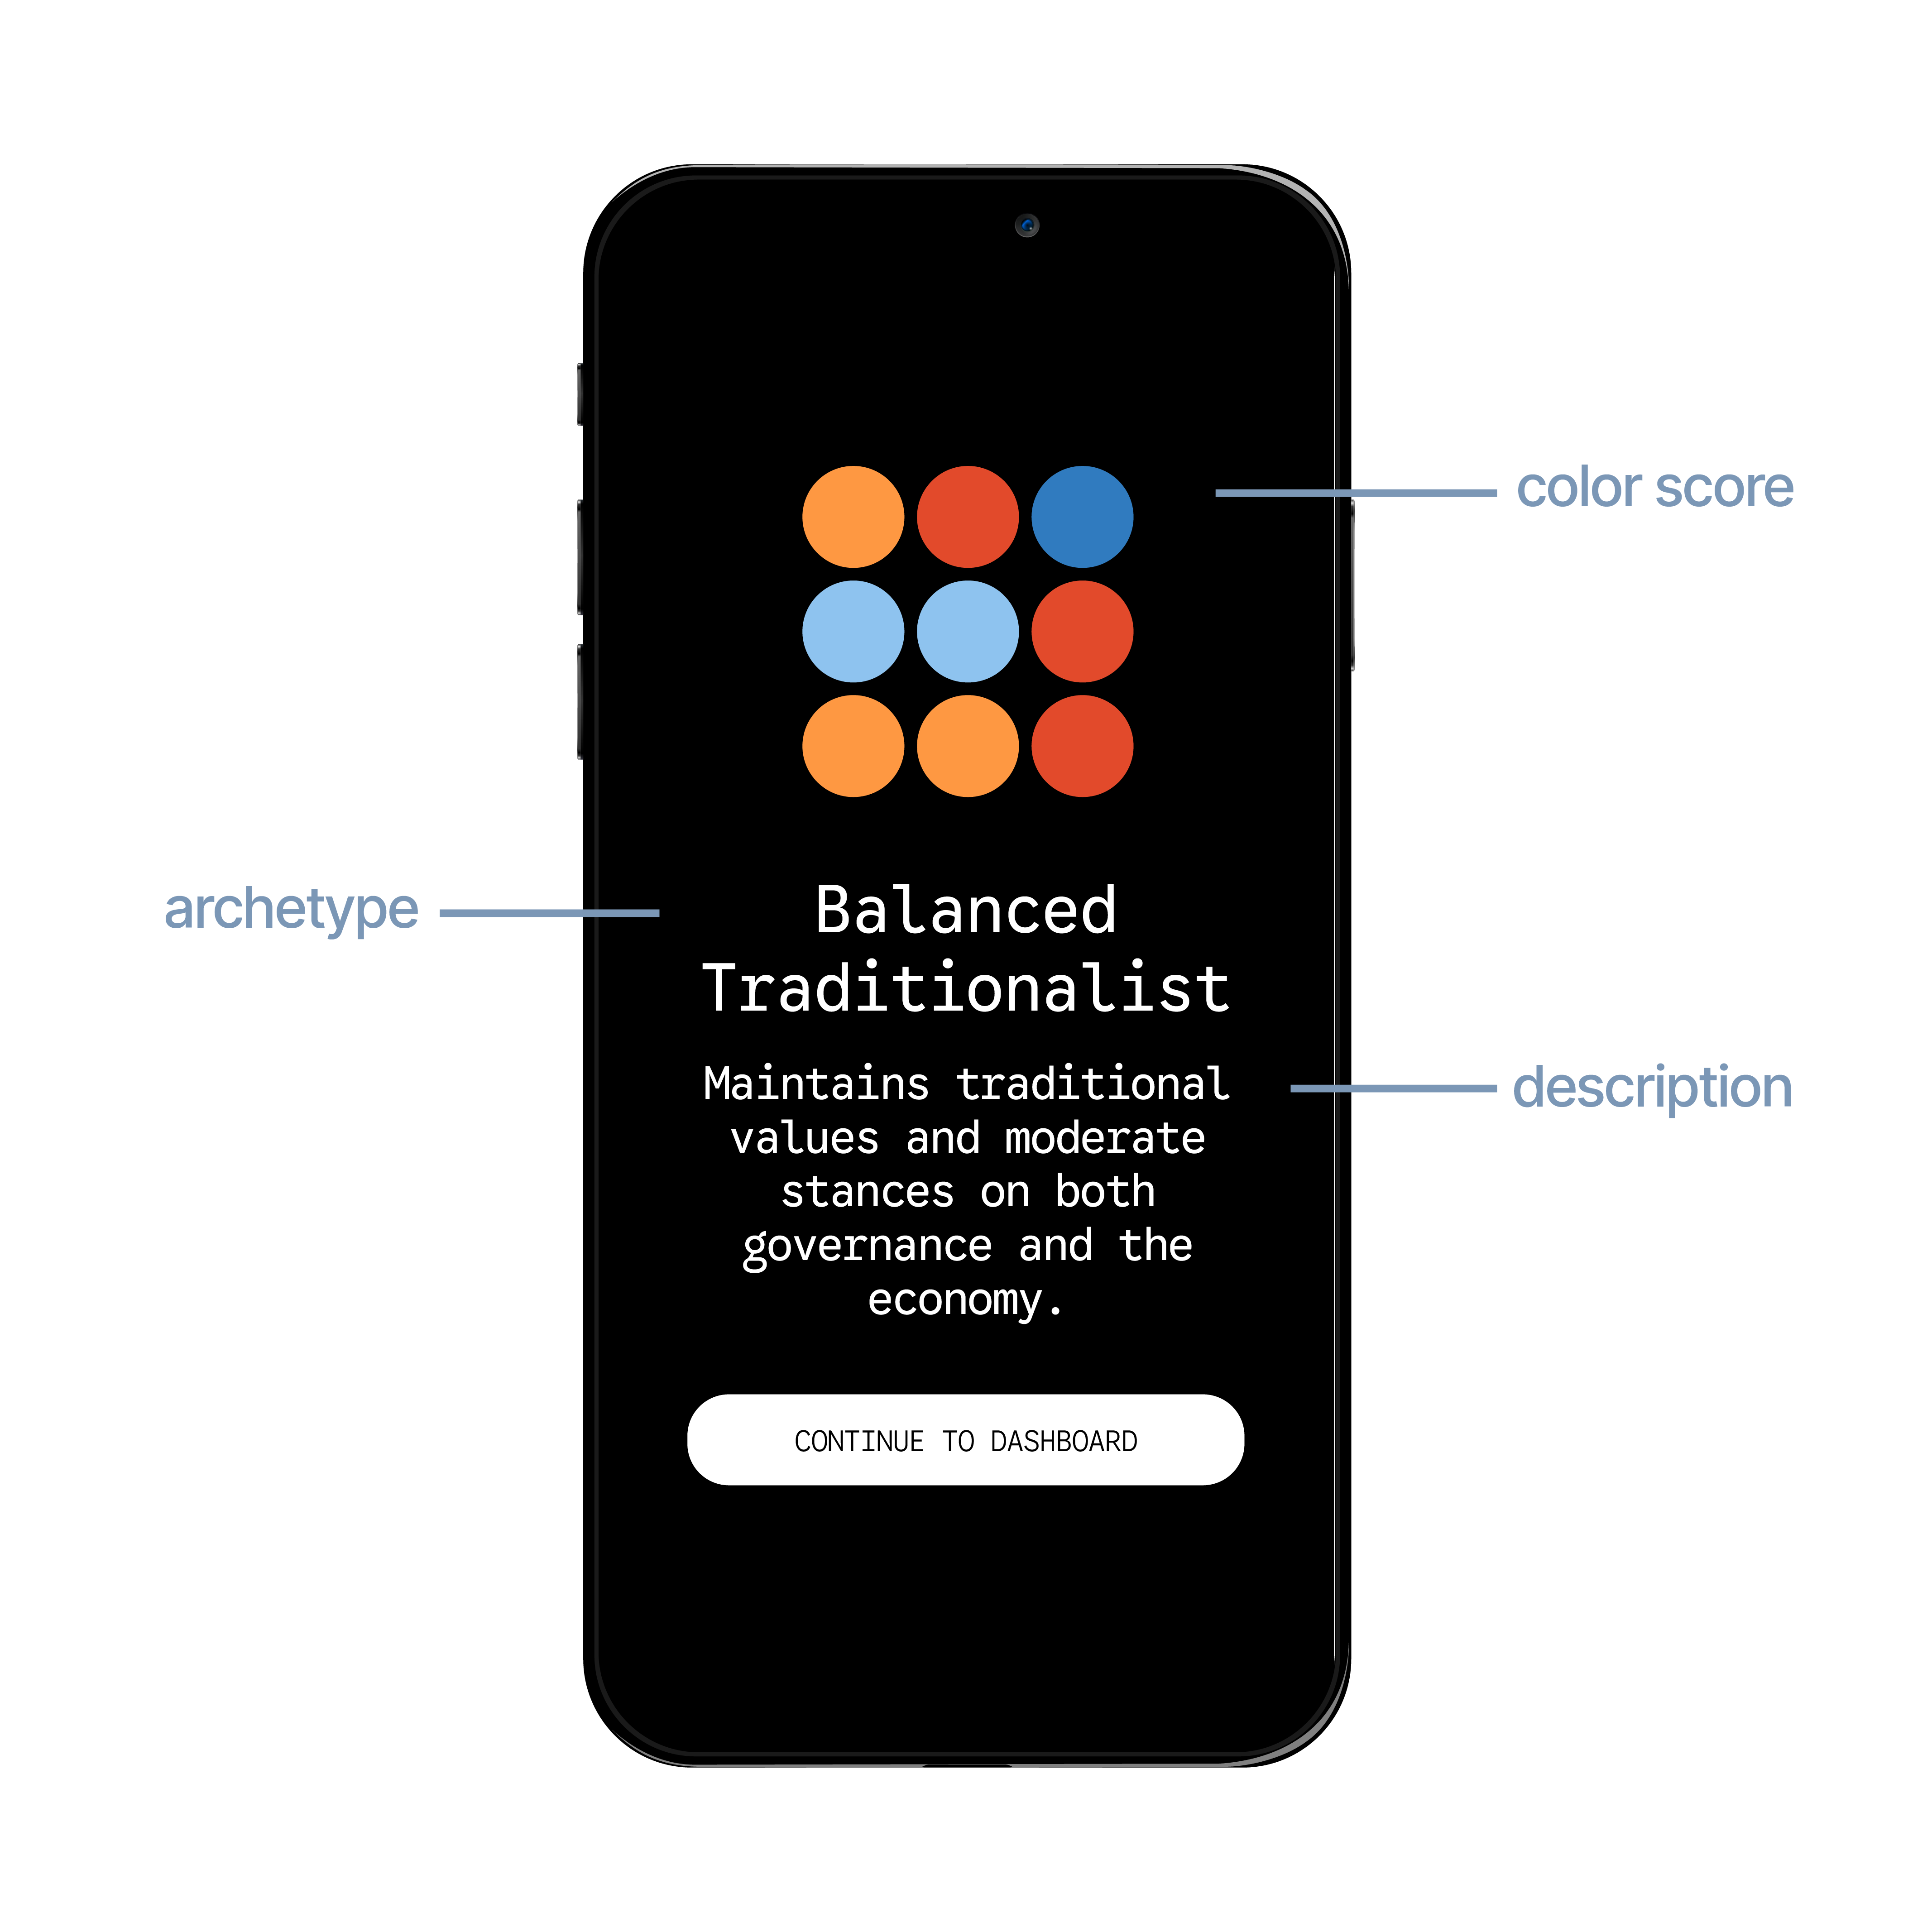
political archetypes/scoring grid
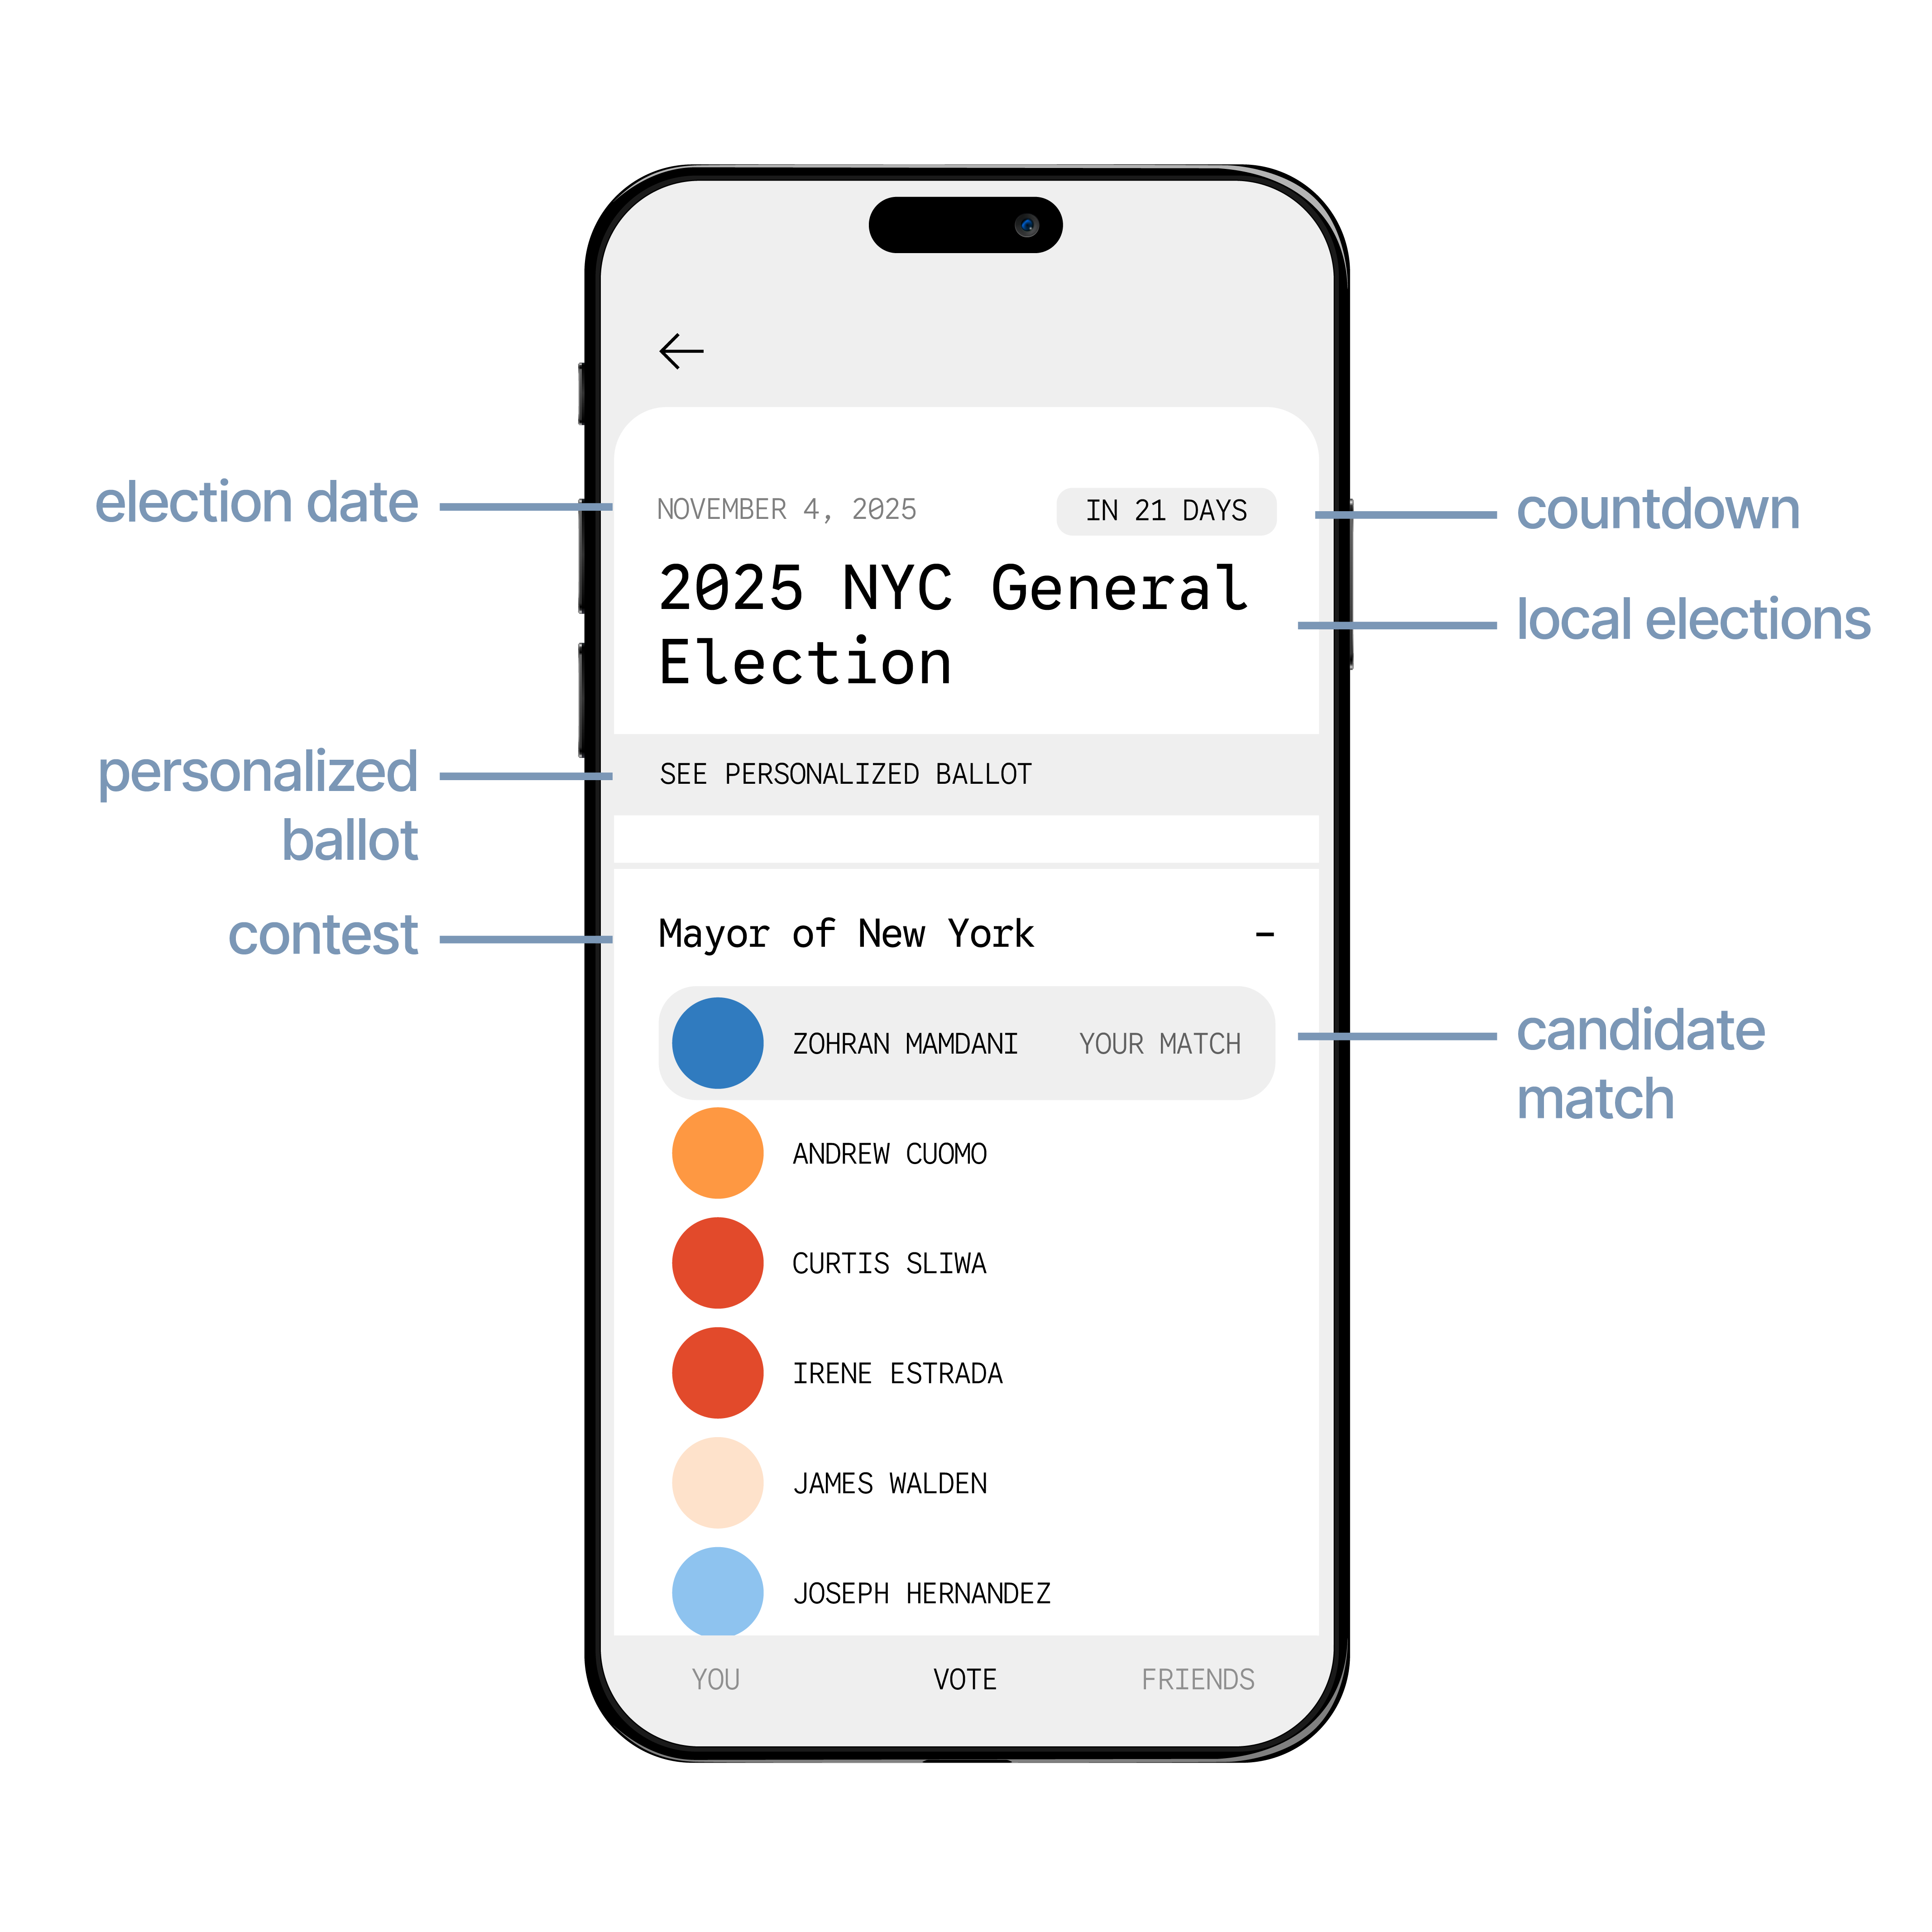
local elections/personalized ballot/matches